Using your Garmin Charts to Locate Fish
From understanding bathymetric contours and relief shading to identifying prime structure and syncing with real-time sonar, this guide walks anglers through the key features that turn a chartplotter into a serious fish-finding tool. Whether you’re chasing offshore predators or hunting local reefs, smarter chart reading means more bites and fewer empty casts.
Whether you’re a weekend angler or a serious offshore sport fisherman, your marine electronics are more than just an aid to safe navigation - they’re powerful fish-finding tools. Garmin multifunction displays (MFDs) are preloaded with advanced charting features that, when understood and used correctly, can help you pinpoint likely fish-holding areas even before you drop a line.
Here’s how to use your Garmin charts to find more fish:
Understand What You’re Looking At
Marine charts aren’t just digital maps. They’re packed with data layers: bathymetry, contour lines, wrecks, reefs, and currents. Even high-resolution relief shading and satellite overlays. Knowing how to read and interpret this information is the foundation of effective fish-finding.
• Depth contours: Tight contour lines mean sudden depth changes. These are often prime fishing spots and “fish highways”.
• Bottom structure: Rocky bottoms, ledges, drop-offs, and underwater humps attract baitfish, which in turn attract predators.
• Wrecks and reefs: Natural and artificial structures are hot zones for species like snapper, grouper, and amberjack.
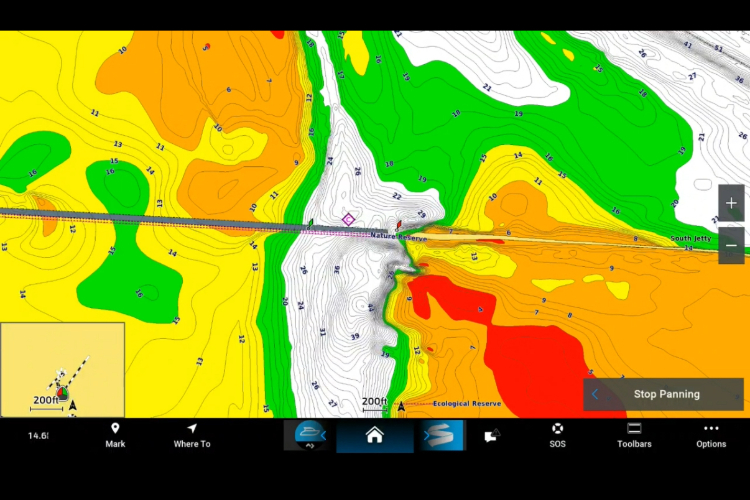
Look for Contour Breaks and Edges using Garmin’s 1’ contours Fishing Maps
Fish often hang around “edges”- where the depth or structure changes quickly. On your chart, these are areas where depth contour lines are tightly grouped. Fish like to patrol these drop-offs to ambush prey moving between shallow and deep water.
Use Relief Shading (available as an option with premium map subscriptions)
High-definition relief shading adds topographic detail to the seafloor and brings it to life. This helps you identify ridges, valleys, and isolated bumps that traditional charts may miss. Relief Shading Imagery combines a predefined color palette and dynamic hill shadowing to provide an easy-to-interpret, clearer view of bottom structure than contour lines alone.
Target Known Hotspots—But Think Like a Fish
Charts often mark known fishing areas, wrecks, or reefs. While these can be productive, they’re also often crowded. The real trick is to find similar areas nearby that aren’t marked.
Ask yourself:
• Is there another ledge at the same depth as the popular one?
• Can you find a lesser-known bump, a few hundred yards away, that shows a similar structure?
Exploring these “off-the-beaten-path” spots can pay big dividends.
Pair with Real-Time Sonar Data
Marine charts are most powerful when paired with real-time sonar data. Use your Garmin Sonar to confirm what your charts suggest.
For example:
• Use sonar to spot fish holding tight to structure.
• Compare your sonar returns to the charted depth and bottom type.
• Mark promising spots as waypoints for future trips.
Download the Latest Garmin Software and Chart Updates
Make sure your Garmin MFD and charting software are current. Garmin regularly releases updates. Updated charts may reveal new wrecks, modified bottom contours, or previously unmapped hotspots. Using the Garmin Active Captain App has only made this easier.
Final Cast
Using your marine electronic charts to find fish isn’t about replacing intuition and experience. It’s about enhancing them. Treat your Garmin MFD like a digital scout. Let it show you the terrain, highlight the promising zones, and guide you to the edges where predator and prey meet.
With a little practice and the right settings, you’ll spend less time searching and more time catching.
Tight Lines and Cheers!